Funding, Volatility and Returns on Binance USDT Perpetuals
Questions
1. Does volatility increase as funding moves away from its +0.01% reference level over 8 hours?
2. Are the sign and magnitude of funding associated with differences in returns?
3. Do these differences persist after funding returns close to its reference level?
Results observed on Binance USDT perpetuals from January 1 to September 8, 2026.
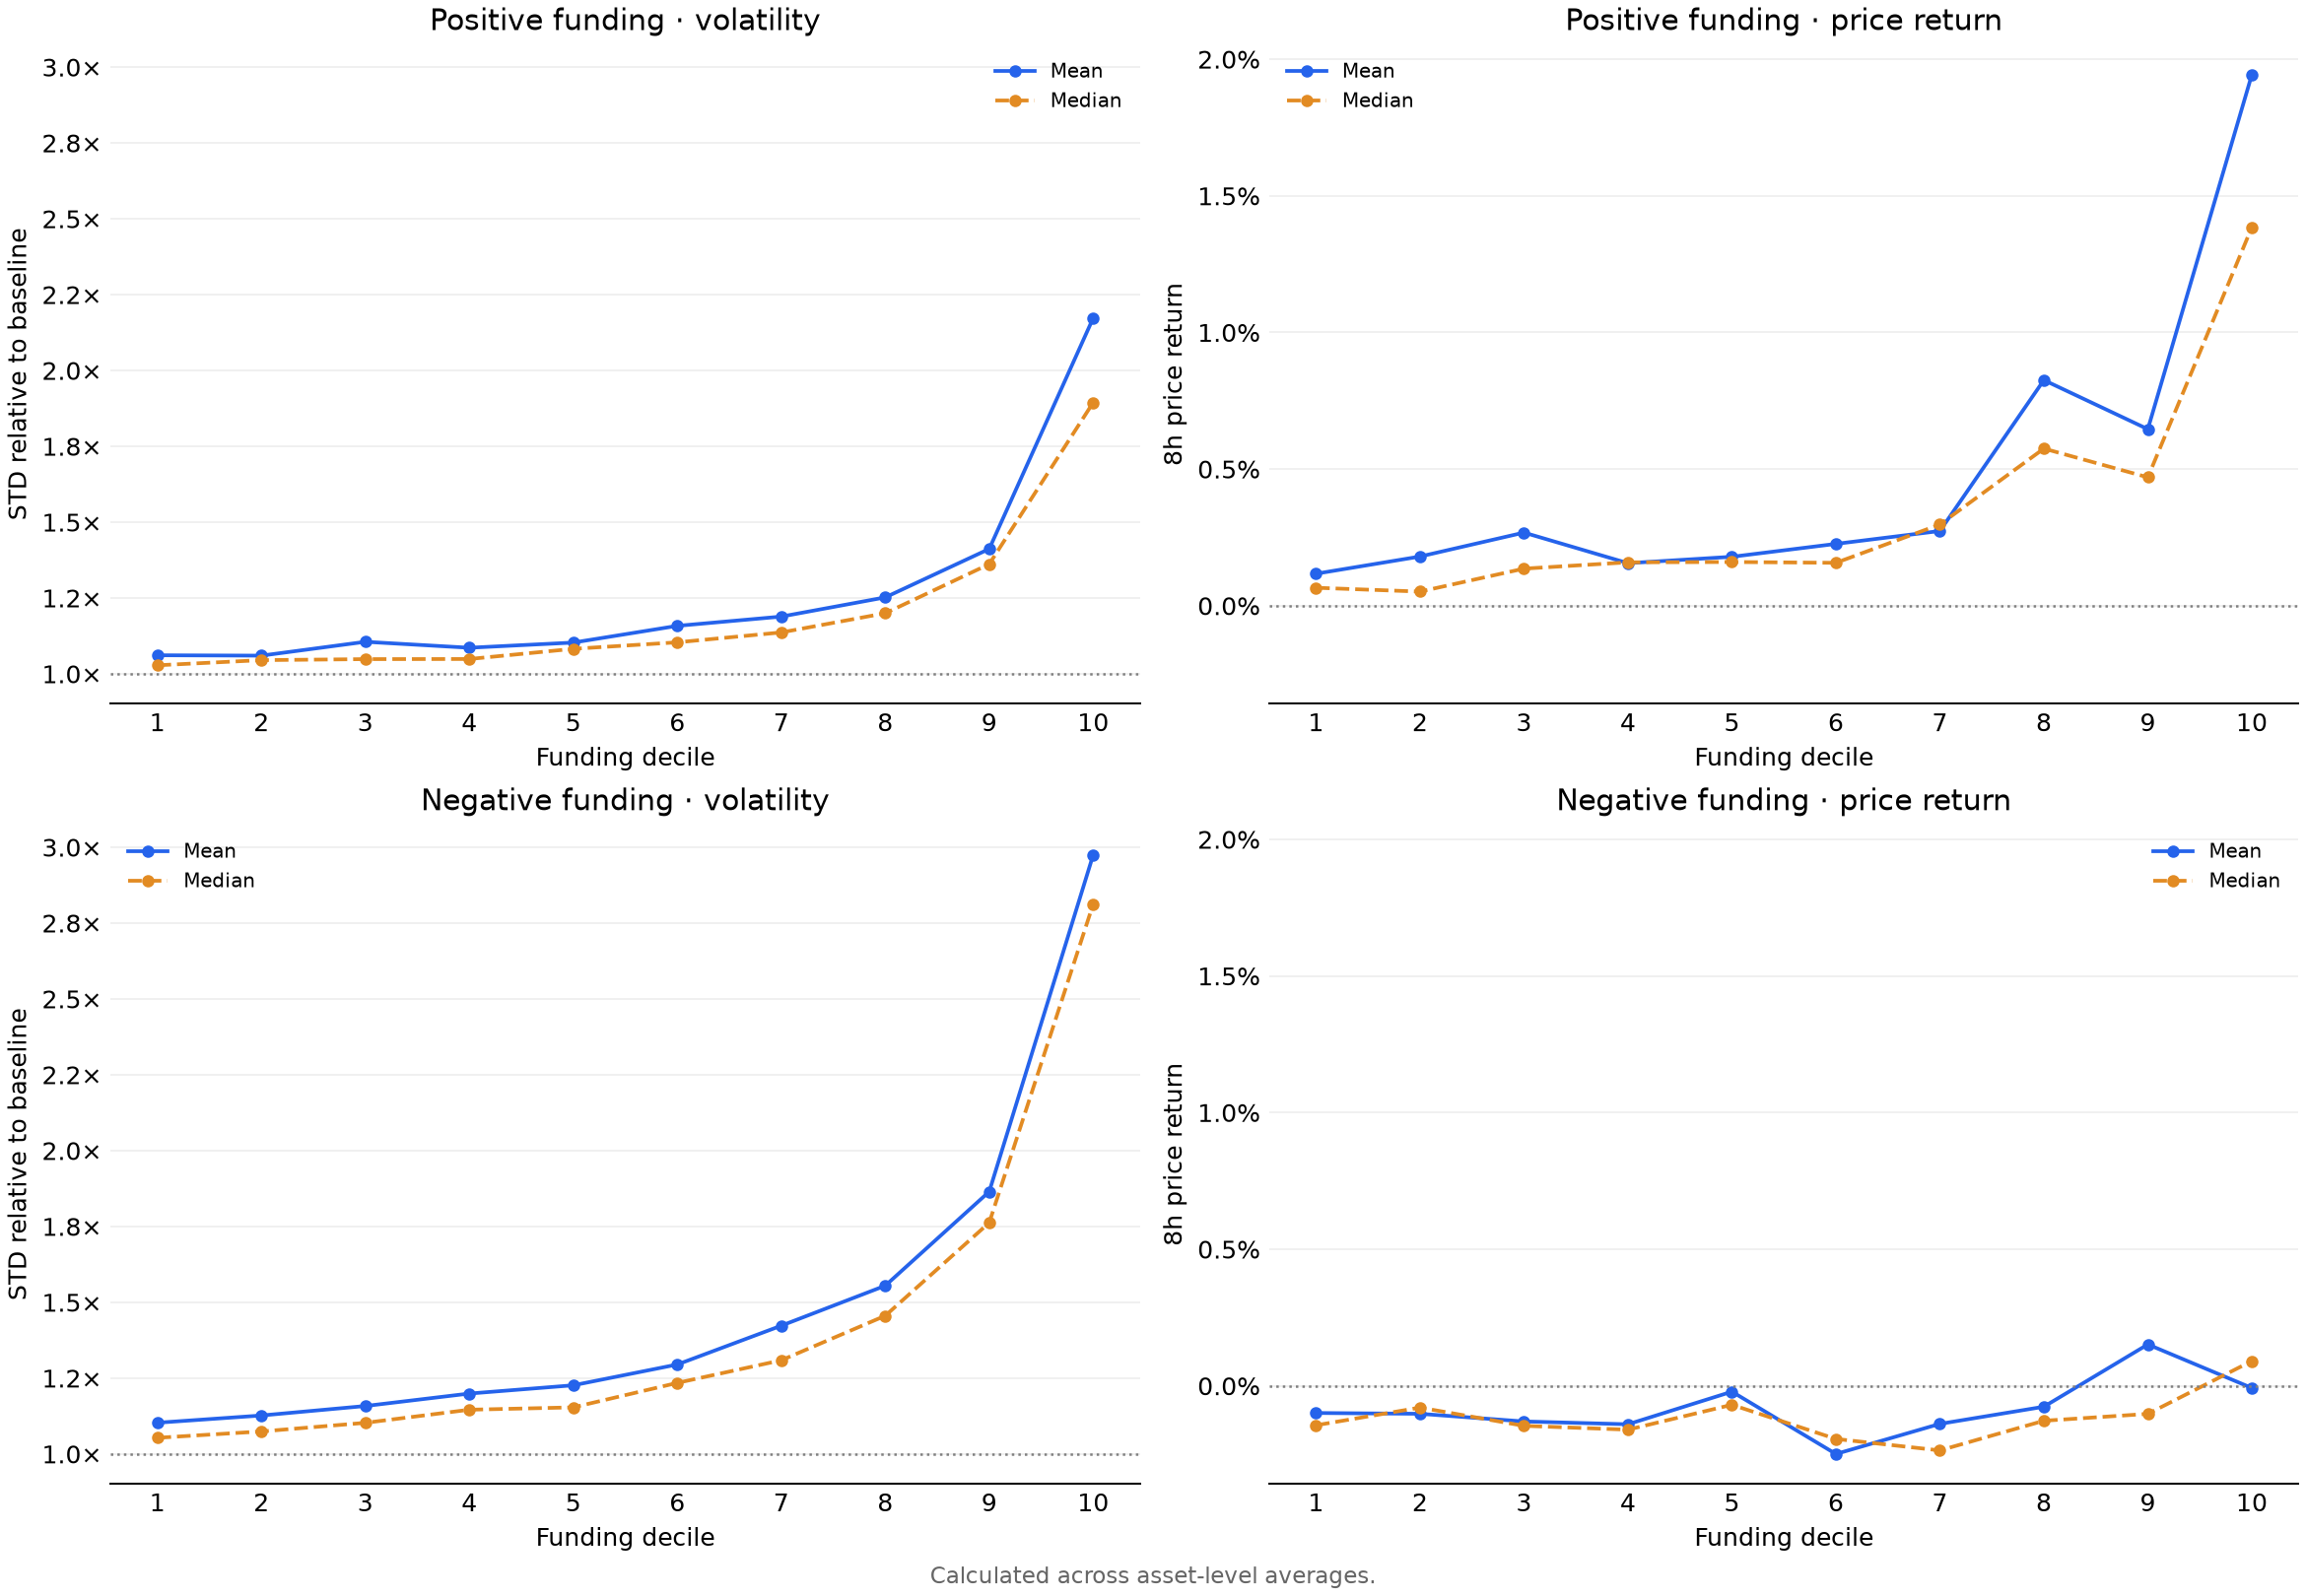
Questions 1 and 2 can be addressed simply by comparing periods with neutral funding (+0.01%) with periods above +0.01% or below -0.01%.
For readers unfamiliar with deciles or quantiles, the tables below show the ranges used in the chart.
Neutral funding
202,991 8-hour windows ~ funding at +0.01%.
| Decile | 8-hour windows | Funding from | Funding to |
|---|---|---|---|
| 1 | 3,728 | +0.010002% | +0.013688% |
| 2 | 3,707 | +0.013688% | +0.017860% |
| 3 | 3,715 | +0.017860% | +0.022806% |
| 4 | 3,731 | +0.022806% | +0.028627% |
| 5 | 3,755 | +0.028627% | +0.035679% |
| 6 | 3,743 | +0.035679% | +0.044640% |
| 7 | 3,763 | +0.044640% | +0.056196% |
| 8 | 3,773 | +0.056196% | +0.073148% |
| 9 | 3,782 | +0.073148% | +0.103916% |
| 10 | 3,775 | +0.103916% | +4.702380% |
| Decile | 8-hour windows | Funding from | Funding to |
|---|---|---|---|
| 1 | 5,363 | -0.010002% | -0.012759% |
| 2 | 5,390 | -0.012759% | -0.016353% |
| 3 | 5,382 | -0.016353% | -0.020835% |
| 4 | 5,380 | -0.020835% | -0.026851% |
| 5 | 5,334 | -0.026851% | -0.035207% |
| 6 | 5,321 | -0.035207% | -0.048244% |
| 7 | 5,363 | -0.048244% | -0.072496% |
| 8 | 5,364 | -0.072496% | -0.126798% |
| 9 | 5,403 | -0.126798% | -0.302542% |
| 10 | 5,436 | -0.302542% | -14.020447% |
On the left, the mean STD of 1-minute returns within each 8-hour window, relative to the mean STD of the same asset when funding is +0.01%. On the right, the mean price return over the same window.