Introduction workspace
Scan the market, follow a shortlist, then inspect the detail.
Scan the market, follow a shortlist, then inspect the detail.
Rank markets by the number of individual executed trades, not their monetary volume.
Open Trades, choose Rolling 1m or Rolling 5m, and select Binance, Hyperliquid or both. The largest trade counts appear first. Each exchange's market is ranked separately, so seeing the same pair twice is expected when multiple exchanges are selected, including with the default filters.
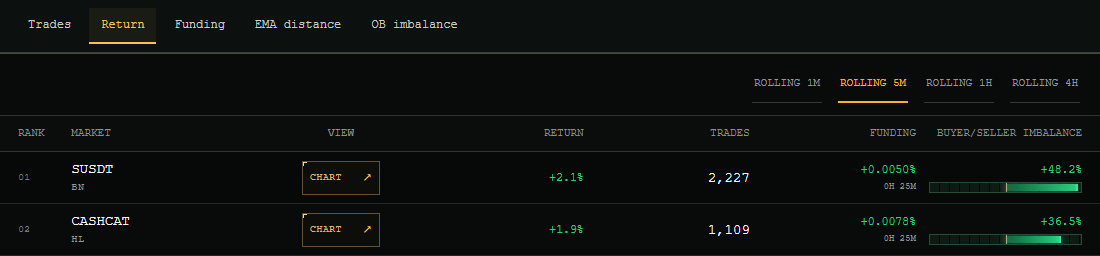
The Return shown alongside Trades compares the first and last observed trade prices in that window. Buyer/Seller Imbalance uses trade counts: buys minus sells, divided by total trades. Positive values indicate more buyer-side trades; negative values indicate more seller-side trades. This is not a volume-weighted measure.
Find the largest moves in either direction. Rankings use absolute return, while the displayed sign keeps the direction.
For 1h/4h, the reference is the close of the candle ending at the minute boundary one or four hours before the current minute.
Compare the quoted rate, or normalize different funding intervals to one hour.
Both modes rank by absolute rate. A large negative rate can therefore rank above a smaller positive rate. The sign is preserved in the value.
Measure how far the latest price sits above or below an exponential moving average.
For example, EMA 100 on 1 Hour uses hourly observations, not 100 minutes. The default is EMA 100 on 1 Min.
Distance is (latest price - EMA) / EMA, displayed as a percentage. Positive means above the EMA; negative means below it. The Top 10 is ordered by absolute distance, not only by markets above the average.
The row includes the EMA value and latest price. Its Chart action uses the chosen interval and period. Results depend on the relevant history being ready.
OB imbalance compares weighted resting bids and asks from mapped Binance Spot books. It is a beta view, not a futures orderbook.
The range is ±2% around the midpoint of the best bid and ask. Each level's quantity is weighted by 1 / (1 + distance in basis points), so nearer liquidity contributes more.
Raw imbalance is weighted bids minus weighted asks, divided by their sum. The ranking uses its absolute magnitude. Positive means bid-heavy; negative means ask-heavy. Bid Share and Ask Share are derived from the smoothed imbalance.
The imbalance uses a time-based exponential average with a five-second time constant. This is not a simple average of the last five samples. The displayed ranking and depth chart update on a one-second cadence; that cadence is separate from the smoothing.
The Chart action shows weighted cumulative Spot depth rather than a candle chart. The depth curve represents the available book snapshot, while the ranking's imbalance is smoothed.
Open an available symbol to inspect its hourly or daily history and current candle.
Search for a symbol such as BTCUSDT and choose the result. Switch between Candles, Line and Area without reloading the same history. The timeframe control offers 1H and 1D.
Daily candles aggregate hourly data by UTC day and update during the current day. Displayed times follow your browser timezone. History length depends on the asset and available data; two years is not a general Chart guarantee.
Open these from Indicator; close a pane with its cross. Individual-chart indicators are disabled on 1D. The individual chart does not automatically open the three pair indicators.
Dragging, scrolling or touch interaction stops automatic live following. Fit chart restores framing and automatic following. Zooming out cannot reveal history that is not available.
Type a pair such as ETH/BTC to compare two available assets at matching candle timestamps.
The line is the left asset's close divided by the right asset's close. ETH/BTC and BTC/ETH are different ratios. The pair view uses a line, not synthetic candles with exact intrabar highs and lows. Both 1H and 1D are supported.
Each pane can be closed independently and reopened from Indicator. The 100-observation window follows the chosen timeframe. Correlation needs 101 aligned closes to form its first 100 returns.
Keep frequently used assets, pairs and Spaghetti views within reach.
Asset search matches symbol prefixes. Pair search accepts ETH/BTC, ETHUSDT/BTCUSDT and unambiguous joined forms such as ETHBTC. Use the explicit slash form when a joined query is ambiguous. Partial pair queries can offer suggestions.
Use the arrow keys to navigate results, Enter to open and Escape to dismiss. The quick search also offers Top 10 Spaghetti and Bottom 10 Spaghetti.
Select the star beside a search result to add or remove it from favorites. Click a saved item to reopen it; its remove control deletes that favorite. Top 10 and Bottom 10 Spaghetti are included by default.
Compare the strongest or weakest daily performers as percentage lines on one chart.
Open TOP 10 SPAGHETTI or BOTTOM 10 SPAGHETTI from search or favorites. Top selects the highest returns; Bottom selects the lowest. This differs from the Screener Return ranking, which orders by absolute movement.
Lines are normalized to 0% at the start of the browser's local day and use hourly data. Membership can change as the daily ranking changes; it is not a permanently fixed basket.
These presets use multiple lines. Style and indicator controls are disabled, and the 1H/1D buttons are hidden. Open an individual asset or pair to leave the preset.
Available Binance TradFi perpetual contracts can be viewed individually or as legs of a pair.
Search the available catalogue, for example for XAUUSDT or TSLAUSDT. These are perpetual contracts, not direct holdings of the underlying asset. Individual and pair views support 1H and 1D.
Chart-only TradFi contracts are deliberately excluded from Screener, Watcher, Top / Bottom Spaghetti, EMA and funding rankings, and Spot orderbook views.
The catalogue depends on supported symbols and prepared history; not every new listing appears immediately. An unavailable search result does not mean the exchange contract does not exist.